Managing Dashboards
A dashboard is a single window in which you can view several monitors that you use regularly. Your dashboards are only visible to you, so you can personalize them as you wish.
Creating a Dashboard
Before you start
Before you can create a dashboard, you must create the monitors you want contained in the dashboard.
- Select
 and then Dashboards.
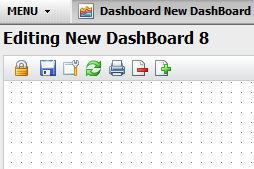
 - From the submenu, select New Dashboard. The Editing New DashBoard window is displayed, with the number of the dashboard shown in the title bar.

- Add the monitor(s) you want to include on the dashboard.
- Set the dashboard options.
- Lock the dashboard if you wish to prevent any further changes.
-
Select
 .
. -
In the Dashboard Name dialog box, key in a name for the dashboard and select
 .
.
Adding Monitors to a Dashboard
-
 Display the DashBoard
- If you are creating a new dashboard, select Menu, Dashboards, New Dashboard.
- If you want to view or edit an existing dashboard, select the arrow on the Dashboard menu button
 or select Menu, Dashboards, Dashboards and then choose the dashboard you want to work with.
-
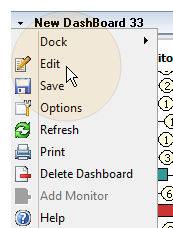
Ensure that you are in edit mode. You should see a dotted grid behind any existing monitors. If not, select
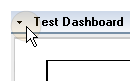
 . If this is not visible, select the small arrow to the left of the dashboard name and then select Edit from the drop down menu
  .
.
- Select
 from the toolbar. Alternatively, right-click in the dashboard display area and select Add Monitor from the menu.
 - A list of available monitors is displayed. Select the one you want to add to the dashboard.
- The monitor is displayed in the top left of the dashboard. You can now resize or reposition it as you wish.
- Repeat for each monitor you want to add.
- Save when you have finished.
- If you are creating a new dashboard, key a name into the Dashboard Name dialog box, and select .
Resizing and Repositioning Monitors on the Dashboard
-
Display the DashBoard
- If you are creating a new dashboard, select Menu, Dashboards, New Dashboard.
- If you want to view or edit an existing dashboard, select the arrow on the Dashboard menu button or select Menu, Dashboards, Dashboards and then choose the dashboard you want to work with.
-
Ensure that you are in edit mode. You should see a dotted grid behind any existing monitors. If not, select . If this is not visible, select the small arrow to the left of the dashboard name and then select Edit from the drop down menu .
- To reposition a monitor, you can click in the title bar and drag the monitor, or right-click in the monitor and select Dock. Then select from the following alignment options:
| Top | to extend it across the top of the screen |
| Bottom | to extend it across the bottom of the screen |
| Left | to display it down the left hand side of the screen |
| Right | to display it down the right hand side of the screen |
| Fill | to display it over the entire dashboard display area |
| Undock | this option is the default and returns the dashboard to its original position |
If you are having difficulty resizing the monitor, undock it and then position your pointer along the border of the monitor and drag to the desired size.
Setting the Dashboard Display
You may want your dashboard to appear when you log in to vFire Core, always appear on top of other open windows, or be held in an external window, and you can set when and how the dashboard is displayed.
-
Display the DashBoard
- If you are creating a new dashboard, select Menu, Dashboards, New Dashboard.
- If you want to view or edit an existing dashboard, select the arrow on the Dashboard menu button or select Menu, Dashboards, Dashboards and then choose the dashboard you want to work with.
- Select the
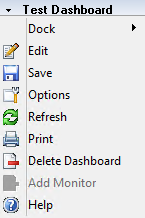
 button on the toolbar. If this is not displayed, select the small arrow to the left of the dashboard name and then select Options from the drop down menu
  .
.
- In the Dashboard Options dialog box, set or update as many of the dashboard options as needed.
- Select Ok to save the settings or Cancel to abandon the changes.
| Dashboard Name | Key in/update the name of the dashboard |
| Open on Startup | Select to display the dashboard as soon as you log on to vFire Core |
| Always on Top | Select to display the dashboard on top of any other windows you are working in.The dashboard must be set to less than the maximum window size. You must close and reopen the dashboard to see this take effect. If the dashboard is obstructing another window, you can reposition it by dragging it to another location, or minimize it by selecting the small minimize button to the right of the title bar  . . |
| Open in a Separate Window | displays the dashboard in a window separate to vFire Core, which you can drag anywhere on your screen. This option has primarily been designed for a dual monitor system. If you are using a single monitor system, any popup windows generated by vFire Core will display behind the dashboard so you should position it away from the center of the screen. You must close and reopen the dashboard to see this take effect |
If the dashboard has the Open in a Separate Window option selected in the Dashboard Options window, it will display in a separate window external to vFire Core. Closing vFire Core will also close external dashboards.
Resizing and Repositioning the Dashboard
-
Display the DashBoard
- If you are creating a new dashboard, select Menu, Dashboards, New Dashboard.
- If you want to view or edit an existing dashboard, select the arrow on the Dashboard menu button or select Menu, Dashboards, Dashboards and then choose the dashboard you want to work with.
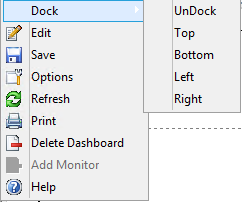
- Ensure that you are in Edit mode. You should see a dotted grid behind the monitors. If not, select . Then right click and select Dock. If you cannot see these options, select the drop-down arrow in front of the dashboard title
 and from the drop-down menu, select the Dock option.
 - This will display another sub-menu with the available docking positions
 . Select where you want to position the dashboard within vFire Core. It will be positioned alongside your other open windows.
 - To remove a docking, select Undock from the list of docking options. This will keep the dashboard floating in a window within vFire Core.
- To resize the dashboard, undock it and then drag the borders to the required size.
Resizing your dashboard will not resize the monitors within. You must resize the monitors separately.
If you are displaying a dashboard outside vFire Core (Open in a Separate Window is selected in the Dashboard Options), you cannot dock and undock the dashboard when it is external to vFire Core. You must change the viewing option and then alter the positioning.
Locking and Unlocking the Dashboard
After you have finished editing your dashboard, you can lock it to prevent any further changes. When it is in Edit mode, the background is displayed as a dotted grid. The dashboard is locked if the background (behind the monitors) is solid white.
Select  to lock the dashboard. The grid disappears and the button changes to . Select this button to unlock the dashboard again.
This option is not available if the dashboard is set to always display on top.
Viewing the Dashboard Details
- If you are creating a new dashboard, select Menu, Dashboards, New Dashboard.
- If you want to view or edit an existing dashboard, select the arrow on the Dashboard menu button or select Menu, Dashboards, Dashboards and then choose the dashboard you want to work with.
The selected dashboard is displayed in a dashboard window.
You can change your dashboard display options or resize or reposition it as necessary.
Drilling Down on Details
You can view the details on any of the monitors on the dashboard.
- Ensure that you are not in Edit mode. If you can see a dotted grid behind the monitors, lock the dashboard by selecting or clicking on the small arrow in the top left corner of the dashboard and selecting Lock.
- If you are working with a pie chart, click on it to see the details.
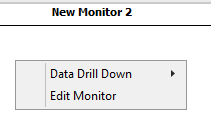
If you are working with a bar or column chart, right click on the monitor and select Data Drill Down from the drop down menu .
. - Select the data you want to view from the drop down menu. The Monitor Drill Down window is displayed on a separate tab. You can drill down from the monitor to examine the detail further if you wish.
Printing the Contents of the Dashboard
You can print a snapshot of the dashboard to record details at a given date and time.
-
Display the DashBoard
- If you are creating a new dashboard, select Menu, Dashboards, New Dashboard.
- If you want to view or edit an existing dashboard, select the arrow on the Dashboard menu button or select Menu, Dashboards, Dashboards and then choose the dashboard you want to work with.
- Select
 to print the dashboard. If this is not displayed, select the small arrow to the left of the dashboard name and then select Print from the drop down menu .
The dashboard is previewed, with the date and time.
to print the dashboard. If this is not displayed, select the small arrow to the left of the dashboard name and then select Print from the drop down menu .
The dashboard is previewed, with the date and time. - Print the image or select Close to return to the vFire Core screen.
Editing Monitors on a Dashboard
You can edit monitors from within the dashboard.
-
Display the DashBoard
- If you are creating a new dashboard, select Menu, Dashboards, New Dashboard.
- If you want to view or edit an existing dashboard, select the arrow on the Dashboard menu button or select Menu, Dashboards, Dashboards and then choose the dashboard you want to work with.
- Ensure that you are in Edit mode. You should see a dotted grid behind the monitors. If not, select or the down arrow in the top left corner of the monitor and select Edit.
- Right click on the monitor and select Edit Monitor from the drop down menu .
- You are taken to the first step of the monitor wizard, from where you can update your monitor settings.
Deleting a Monitor from a Dashboard
Before you start
Before deleting a monitor in a dashboard that has been set to Always on Top or Open in a Separate Window, ensure that the dashboard is small enough or positioned so that you can see confirmation messages on your screen. Use the Dashboard Options to resize or relocate it if necessary.
- Select the arrow on the Dashboard menu button or select , Dashboards, Dashboards and then choose the dashboard you want to work with.
- Ensure that the dashboard is in Edit mode. The dashboard background should be a dotted grid. Select if necessary.
- Right click on the monitor, and select
 .
. -
Do not select the
button from the toolbar , as this will delete the entire dashboard.If the dashboard has been set to Always on Top and Open in a Separate Window, the deletion may appear to crash vFire Core because the dashboard is obscuring the confirmation window. Press the [Esc] key to cancel the confirmation window and re-activate the monitor. Then use the Dashboard Options to resize or relocate the dashboard.
- Save the changes. You will be prompted to save if you exit without saving changes you have made.
Deleting a Dashboard
-
Display the DashBoard
- If you are creating a new dashboard, select Menu, Dashboards, New Dashboard.
- If you want to view or edit an existing dashboard, select the arrow on the Dashboard menu button or select Menu, Dashboards, Dashboards and then choose the dashboard you want to work with.
- Select . If this is not displayed, select the small arrow to the left of the dashboard name and then select Delete Dashboard from the drop down menu .
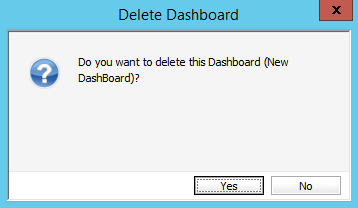
- A warning message displays asking you to confirm the deletion.
 . Select
  to delete the dashboard and
  to quit without saving.
 - Confirm the deletion.